Random Forests of Titanic Survivors
14 June 2013
The other day I realized I've told countless people about Kaggle, but I've never actually participated in a competition. I've always imagined that if I entered a competition, it would consume a good portion of my time and I'd start neglecting other duties. That said, I decided to enter one this past weekend. (I'm envisioning my entry like the start of any Quantum Leap episode: "Theorizing that one could time travel within his own lifetime, Dr. Sam Beckett stepped into the Quantum Leap accelerator and vanished.". Except my version doesn't involve quantum anything, and while Sam looks like he's talking to himself but he's really talking to Al, I'm just talking to myself.)

The competition
The competition I chose first was Titanic: Machine Learning from Disaster; their "training" competition. In a nutshell, Kaggle provides information on 891 Titanic surivors and whether they survived. Then they provide me with a test set of 418 passengers with the same data except whether they survived. My job is to train an algorithm to predict whether these 418 people survived, upload my predictions in a format for Kaggle to automatically score, then watch as they rank me on a leaderboard. Technically there is one additional step where I become obsessed about my position on the leaderboard and start staying up all night to improve things, but we won't talk about that here :) Here is the info Kaggle provides to me:
- Passenger class
- Name
- Sex
- Age
- Siblings & spouses aboard (integer)
- Parent & children aboard (integer)
- Ticket number
- Fare
- Cabin
- Port of embarkation
My approach
Since this is meant as a training project, Kaggle provides some introductory advice on training an algorithm for a few environments like Excel and Python. I decided I would skip those and see how well I could do on my own with some help from my trusty friend R. My initial approach is based on the wonderfully-versatile random forest technique. As yhat have pointed out recently, "Random forest is the Leatherman of learning methods. You can throw pretty much anything at it and it'll do a serviceble job". That's a great first technique for this project since I'm trying to get an initial idea of how deep the problem is in a quick fashion. Here's my initial process as an outline:
- Read training set file into memory
- Do any data cleanup needed
- Factorize those data columns that are really factors
- Train my random forest using the in-memory training set
- Observe the error estimate from the forest model
- If everything looks good, produce predictions for the Kaggle-provided test set, and write them in Kaggle's preferred output format
Let's discuss the code we'll write block by block, then I'll provide the entirety as a gist.
The first few lines are very pedestrian; we read the file in and set column types.
library(randomForest)

passengers <- read.csv("~/code-projects/kaggle/titanic/data/train.csv",
                      comment.char="", quote="\"", sep=",", header=TRUE, stringsAsFactors=FALSE,
                      colClasses=c("integer", "integer", "character", "character", "numeric", "integer", "integer", "character", "numeric", "character", "character"))
Next, there are a few rows that have no port of embarkation specified. We should really address these, but for now we'll remove them from our training set. The prepFeatures code (and the code directly above it) performs that factorization I mentioned in the process outline; there are a small number of distinct values for pclass, sex, embarked, and survived, so let's treat them as such. Notice that some people have no age; we should determine if we can estimate the age based on other factors, but for now let's just give them all the same arbitrary age.
# TODO - should we keep these rows?
passengers <- passengers[which(passengers$embarked != ""),]

passengers$survived <- as.logical(passengers$survived)
passengers$survived <- factor(passengers$survived)

prepFeatures <- function(df) {
  # Let's treat enumerations as factors
  df$pclass <- factor(df$pclass)
  df$sex <- factor(df$sex)
  df$embarked <- factor(df$embarked)

  # TODO - Fixing missing ages
  df[which(is.na(df$age)),]$age <- 99

  return(df)
}

passengers <- prepFeatures(passengers)
Now comes the meat of the code: We define a function that will return a random forest model trained on provided data. We use the randomForest method from the CRAN package of the same name. We then identify the columns of data that we would like to include in the model, train, and observe the console output.
trainForestModel <- function(trainingFrame, cols) {
  model <- randomForest(survived ~ ., data=trainingFrame[, c("survived", cols)])
  print(model)
  return(model)
}

# So let's create a model
modelCols <- c("pclass", "sex", "embarked", "fare", "sibsp", "parch")
model <- trainForestModel(passengers, modelCols)
Let's look at the console output from R at this point:
Call:
 randomForest(formula = survived ~ ., data = trainingFrame[, c("survived",      cols)])
               Type of random forest: classification
                     Number of trees: 500
No. of variables tried at each split: 2

        OOB estimate of  error rate: 18.56%
Confusion matrix:
      FALSE TRUE class.error
FALSE   507   42  0.07650273
TRUE    123  217  0.36176471
What the console is telling us here is that we are building a classification type of random forest (as opposed to a regression). We are building 500 (the default) trees in our forest. The model's estimate is that our OOB (out-of-bag) error rate is 18.56%. You will notice that unlike other machine learning techniques like a linear regression, we don't need to separate our data into training and test data to determine approximate error rate; the properties of the model (namely that only a subset of information is used to train each tree) are such that we can use remaining test cases from each training set to test the overall model. Also worth noting is the confusion matrix of the model's estimate: apparently we are currently very good at predicting when someone did not survive (~ 92.3% accuracy), but need some work in predicting when someone survived (~ 63.8% accuracy).
Now we load the real test data from Kaggle without any survivorship data, and run it through our trained model. Nothing new to really note here.
# And load Kaggle's test data
testdata <- read.csv("~/code-projects/kaggle/titanic/data/test.csv",
                       comment.char="", quote="\"", sep=",", header=TRUE, stringsAsFactors=FALSE,
                       colClasses=c("integer", "character", "character", "numeric", "integer", "integer", "character", "numeric", "character", "character"))

testdata <- prepFeatures(testdata)

# And predict their results
prediction <- predict(model, newdata=testdata, type="class")
Finally, Kaggle wants to see predictions as a single file with a header line, followed by a series of newline-separate 1's and 0's indicating survivorship in the same order as we received for the test data. We'll write these by using R's write.table function, but first we have to coalesce the logical values into integers. We do that with a neat little trick by adding 0 to their logical values.
# And let's write our prediction results
out.frame <- data.frame(survived=as.logical(prediction)+0)

# TODO - if there are any NAs let's assume they didn't survive for now
out.frame[which(is.na(out.frame$survived)),] = 0

write.table(out.frame, file="~/code-projects/kaggle/titanic/prediction.tsv", sep=",", quote=FALSE, col.names=TRUE, row.names=FALSE)
Here's that code as a complete gist:
Results
Now we've got a file that's in Kaggle's preferred format, ready for submission to be graded! Let's see how we did:
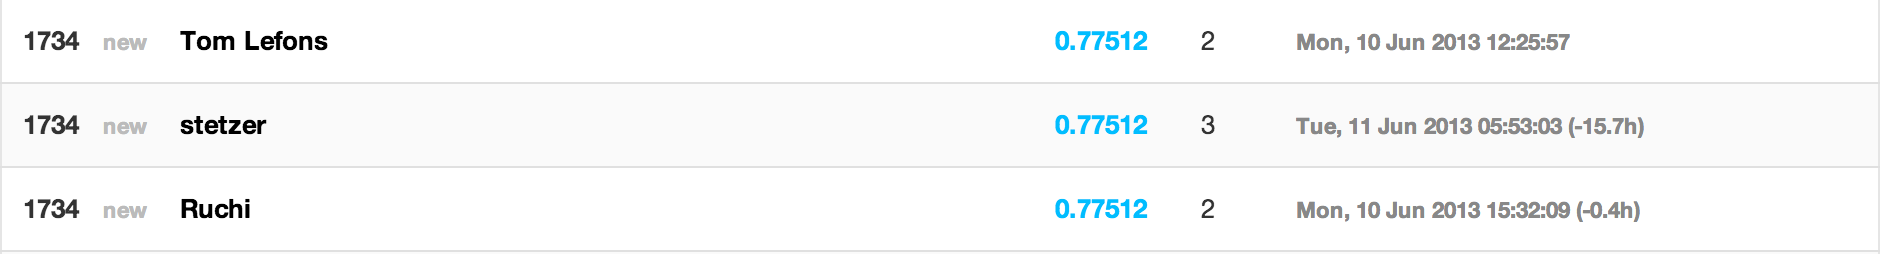
Not bad for ~ 50 lines of code! In a very short time, we were able to build a quick model that can predict Titanic survivorship based on a few details about the passengers, with ~ 78% accuracy! Turns out this is also the same accuracy the Kaggle-suggested first model achieves; they also used a basic random forests approach.
Real-world applications
You may be asking yourself what some real-world applications to these models might be. Random forest models have been used for (among other things):
- Medical diagnosis
- Predicting a person's age
- Aircraft engine fault diagnosis
- Predicting severe weather events
As you can see, it really is "the Leatherman of learning methods"!
What's next?
In a future post, I will show how we can improve upon our basic model with additional feature extraction and/or alternative learning techniques.
Applied combinatorics and Legos
28 May 2013
The following is a blogged version of a 5-minute lightning talk I gave recently at a Data Science Indy meetup. The title of the talk was Applied Combinatorics or: How much do I have to spend to get the Chicken Suit Guy?

I love Legos. More specifically, my 2 year-old son loves Legos, and I love playing with him. One of our favorite things about Legos are their minifigures. Lego has these neat rotating series of minifigs (as they're called) where they create some unique figs and sell them in "blind bags" so that you don't know which figure in the series you are getting. Pictured above is the Series 9 collection, which is comprised of 16 unique figures like Mr. Good and Evil, Heroic Knight, and Chicken Suit Guy.
A store near our house sells these bags for $3, and we wanted to get Chicken Suit Guy. The question is, how do we get him without looking like a creepy person in the store that is feeling up all of the lego bags? One option would be to just start buying bags until we get him. In fact, that's what his mom and Grandmother wanted to do. Me being the nerdy fun killer I knew there was a smarter, albeit more math-involved, way to get Chicken Suit Guy without breaking the bank. Math to the rescue! Here's the breakdown:
Problem
At first we wanted Chicken Suit Guy, but we didn't want to spend any more money than we had to. That eventually turned into us wanting all 16 figures with spending the least amount of money.
Known Facts
- Blind bags cost $3 (each).
- The figure inside a blind bag is random.
- The degree of randomness is unknown (some figures appear to be more rare than others), but all figures in this series appear to be reasonably common.
- You can go on eBay and buy figures like Chicken Suit Guy, typically for about $7.
Approach
In combinatorics, this is a variation of the classic coupon collector's problem. Simply put, given n minifigs, how many minifigs do I expect to buy before getting all of them. Since this was going to be presented at a data science meetup, my first thought was to talk about logarithms and harmonic numbers, but I was told there were a fair amount of people at the meetup who were more data science-curious, so I instead decided to base my talk on the output of running a large number of samples and taking the average as a determining factor. I would leave something for the stat/probability geeks in the house though, as I'd do my simulations in R.
Below is R code that defines a series of functions to approximate how many purchases it would take to collect a distinct set of all figures of size n, how many purchases would be needed to finish a set of size n given a starting size seen, and how many purchases it would take to see the next unique figure, again given set size n and starting size seen. At the bottom of the code, we do an example trial run.
An example run of the code yields the following results:

| Total Figures | Unique Figures | Money Spent |
|---|---|---|
| 1 | 1 | 3 |
| 2 | 2 | 6 |
| 3 | 3 | 9 |
| 4 | 4 | 12 |
| 5 | 5 | 15 |
| 6 | 6 | 18 |
| 7 | 6 | 21 |
| 8 | 7 | 24 |
| 9 | 8 | 27 |
| 10 | 8 | 30 |
| 11 | 9 | 33 |
| 12 | 9 | 36 |
| 13 | 10 | 39 |
| 14 | 11 | 42 |
| 15 | 11 | 45 |
| 16 | 11 | 48 |
| 17 | 11 | 51 |
| 18 | 11 | 54 |
| 19 | 12 | 57 |
| 20 | 12 | 60 |
| 21 | 12 | 63 |
| 22 | 12 | 66 |
| 23 | 12 | 69 |
| 24 | 12 | 72 |
| 25 | 12 | 75 |
| 26 | 12 | 78 |
| 27 | 12 | 81 |
| 28 | 12 | 84 |
| 29 | 12 | 87 |
| 30 | 12 | 90 |
| 31 | 12 | 93 |
| 32 | 12 | 96 |
| 33 | 12 | 99 |
| 34 | 12 | 102 |
| 35 | 12 | 105 |
| 36 | 12 | 108 |
| 37 | 12 | 111 |
| 38 | 12 | 114 |
| 39 | 12 | 117 |
| 40 | 13 | 120 |
| 41 | 13 | 123 |
| 42 | 14 | 126 |
| 43 | 14 | 129 |
| 44 | 14 | 132 |
| 45 | 14 | 135 |
| 46 | 14 | 138 |
| 47 | 15 | 141 |
| 48 | 15 | 144 |
| 49 | 15 | 147 |
| 50 | 15 | 150 |
| 51 | 15 | 153 |
| 52 | 15 | 156 |
| 53 | 15 | 159 |
| 54 | 16 | 162 |
Conclusions
What conclusions did I draw from my simulations?
- It will take about 54 purchases, or $162, on average to collect a complete set of all 16 minifigs.
- Going to eBay and buying each fig for $7 each is actually cheaper, with a total cost of around $112.
- If I switch to eBay purchasing after collecting 9 figures, I will optimize my total cost down to ~ $90.
$5.63 / figure is pretty good considering a starting cost of $3 for a random selection!
Addendum
As one meetup member pointed out, I am not assigning any value to duplicates that we collect. Honestly that's mainly a factor of my son being little and losing his toys all over the house, so duplicates are good for spare parts :)
First Post
24 May 2013
Welcome to my new & improved blog. Now hosted via GitHub, backed by the power of a thousand octocats, I'm sure it will provide meaningful insights to all of the universe's problems. Ok, maybe not.
On a more serious note, I do plan on posting around topics like data science with R, data crunching with frameworks like Spark, and probably a disproportionate amount of info on Legos.
Thanks for visiting!